Adjusting the polarization direction of the X-rays, scanning transmission imaging of the sample with right and left circularly polarized light, respectively, and subtracting the two images, the magnetic domain microscopic image is thus obtained.

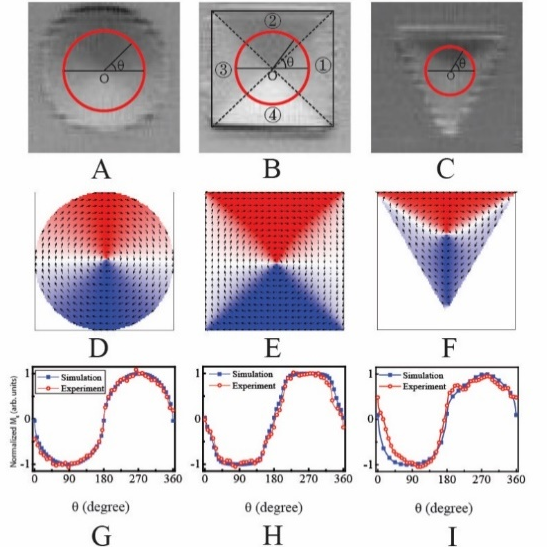
(A-C) STXM micrographs of circular, square, and triangular magnetic microstructures, respectively, and the scale of each figure is 2 um; (D-F) are the magnetic domain distributions in the three structures simulated by micromagnetism. The red dots in (G-H) denote the horizontal magnetization intensities (HMI) of the points on the red circles in (A-C); and blue dots denote the HMIs of the corresponding positions in (D-F). [Acta Physica Sinica 64, 197502 (2015)]
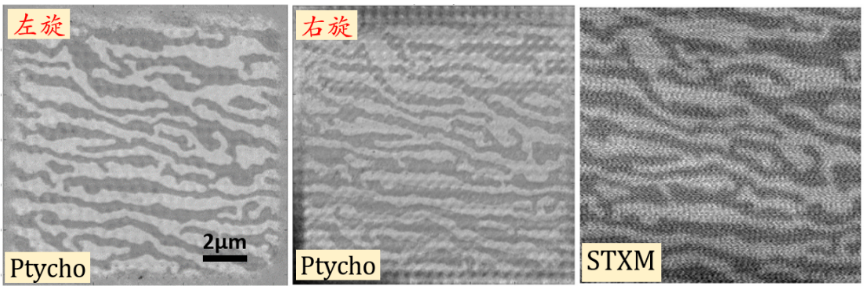
Comparison of magnetic domain imaging by ptychography (left and middle) with that by STXM (right), showing that ptychography further improves the resolution of magnetic domain imaging.
附件下载: