The SSRF BL07U: Spatial-resolved and Spin-resolved ARPES and Magnetism Beamline was officially opened to users from January 2022. In the more than two years so far, we have continuously improved the experimental efficiency, enrichment the experimental conditions, and the experimental capability according to the users' demands and combined with the actual situation of the Shanghai Light Source, and the main achievements so far are: 1) To achieve the function of monochromator- undulator oscillation cooperation, which the monochromator scans at each energy corresponds to the maximum flux when measuring the absorption spectrum. (2) To accomplish the pump-probe experimental method, which can synchronize accelerator clock signal at the experimental station.
1. Monochromator-undulator Intermodulation
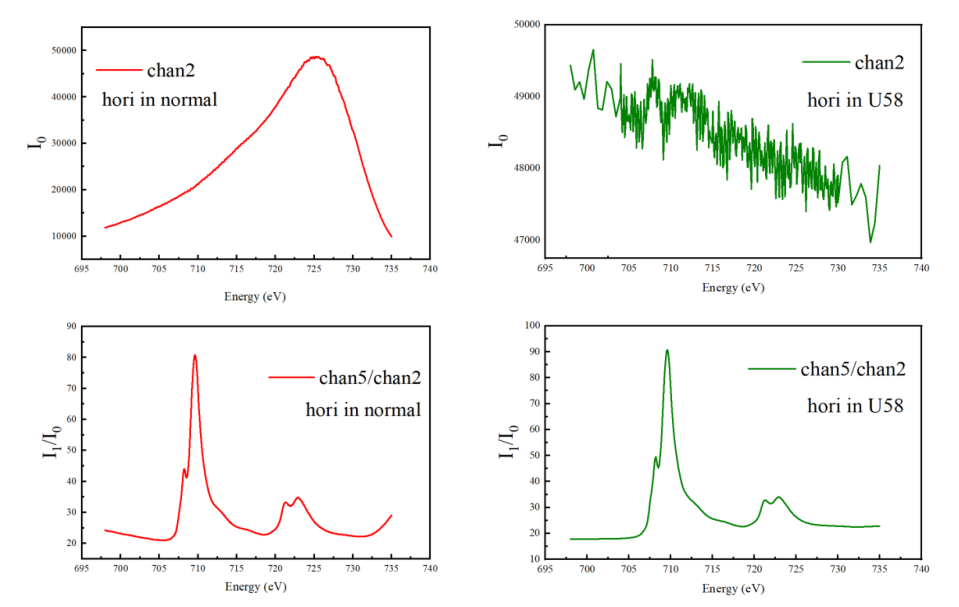
The primary experimental method at the BL07U is the measurement of the near-side absorption spectrum. When measuring the absorption spectrum, a gold grid is usually applied to simultaneously monitor the change in beam light flux and intensity of X-rays. Due to the different absorption cross-sections of X-rays in various materials, when the magnitude of X-ray changes is drastic, the magnitude of changes in the I0 and sample signals measured by the gold mesh are not exactly the same, which results in the absorption spectra obtained after subtracting the background I0 signals having slopes or not being smoothed. To solve this problem, the method of cooperating the monochromator and undulator is usually applied.
As shown the red absorption spectrum on the left side of the figure below, the gold mesh signal I0 presents a curve with a single peak with non-coupled mode. In the energy range from 698 to 725 eV, when the EPU gap fixed, I0 increases with energy raising and achieves the maximum value at 725 eV, and the photocurrent signal intensity increases by a factor of 4; after the energy exceeds 725 eV, the photocurrent signal intensity decreases sharply with the increase of energy. The sharp increase of the side front (698~705 eV) and the sharp decrease of the side back (730~735 eV) of the absorption spectrum led to the downward and upward slopes of the sample signals (I1/I0) in the side front and side back, respectively. This not only affects the shape of the absorption spectrum, but also increases the difficulty of subsequent processing within data analysis. In contrast to the right figure, the green absorption spectrum line, the signal intensity of the gold mesh in the intermodulation mode is always maintained in the photocurrent peak region, and the intensity drop is only 3% in the energy range covered by the whole absorption spectrum. The intensity of the absorption spectrum in the intermodulation mode is better than that in the non-intermodulation mode, and the back bottom of the absorption spectrum is much straighter and smoother.
Monochromator-undulator Intermodulation research in the SSRF BL07U.
2. Time-resolved X-ray ferromagnetic resonance device
The time-resolved ferromagnetic resonance experimental platform, including both the electronics system and the in-situ magnet resonance device, has been built. Subsequently, the electron spin advance curve of ferromagnetic resonance excitation was measured using an alloy sample.
The time-resolved electronics system includes a series of electronic devices such as timers, power amplifiers, comb-wave generators, filters, power meters and pulse generators. We tried to lead the 500MHz signal from the high frequency of the undulator to the experimental station through the optical fiber, and read out the 500MHz Sine-wave signal by using the customized timer and optoelectronic converter. At the same time, the phase difference between the output waveform and the input signal can be adjusted by the time-delaying program, and the minimum adjusting step is 5 picoseconds, i.e., theoretically the minimum time-resolved step of 5 picoseconds can be achieved. The input signal is multiplied by a comb wave generator to obtain a series of high-power high-frequency signals such as 1GHz, 1.5GHz, 2GHz ...... and so on. Then, using a filter, the desired frequency range is selected, and finally an amplifier is used to obtain a maximum of 1.5 Watts of 4GHz RF current at the output. The experimental equipment diagram is shown in Fig. 2.
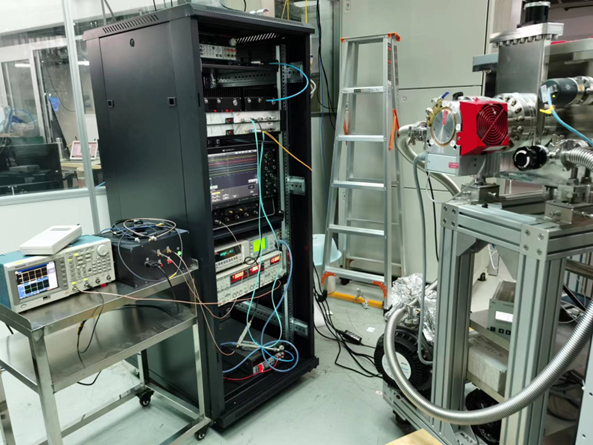
Time-resolved experimental electronics platform.
In-situ ferromagnetic resonance experimental chamber, which contains the displacement stage, SMA interface flange, coplanar waveguide (CPW) and sample stage, magnet, photodiode and other devices is arranged in the left of Fig. 3. The coplanar waveguide that generates microwaves is the core part of the ferromagnetic resonance experimental platform. We first used the HFSS program to simulate and calculate the performance of the CPW, and after determining the parameters, we fabricated the CPW devices on silicon wafers by the micro-nano-processing method, and finally plated the samples on the centre conductor of the CPW. Also customized CPW holder was utilized in the experimental chamber. The CPW device and holder are shown in the right panel of Fig. 3. The customized CPW can generate microwaves with a teeny Gauss amplitude on the surface of the centre conductor when a high-frequency current with a power of 1 W is input.
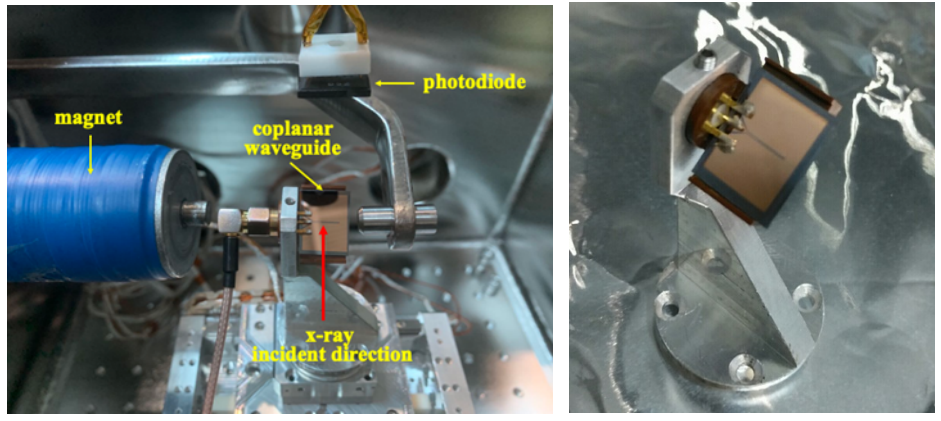
(Left) In-situ ferromagnetic resonance (IMR) chamber; (Right) CPW and customized holder fabricated with micro-nano-machining methods.
An experimental picosecond time-resolved X-ray ferromagnetic resonance (TR-XFMR) apparatus with a time resolution of 13 ps (RMS) or 31 ps (FWHM) was constructed and demonstrated in the 07U and 08U1A soft X-ray beamlines at the Shanghai Synchrotron Radiation Facility (SSRF) using pump-probe detection and X-ray magnetic circular dichroism (XMCD) spectroscopy. Element Nd time-resolved ferromagnetic resonance was excited by continuous microwave phase-locking of the bunch clock within the photon beam during synchrotron radiation and was characterized by detecting the magnetic circular dichroism signals of the elements of interest in the magnetic films. Using this equipment, we measured the amplitude of the element-specific moment precession during ferromagnetic resonance (FMR) at 2 GHz in a single Ni81Fe19 layer.
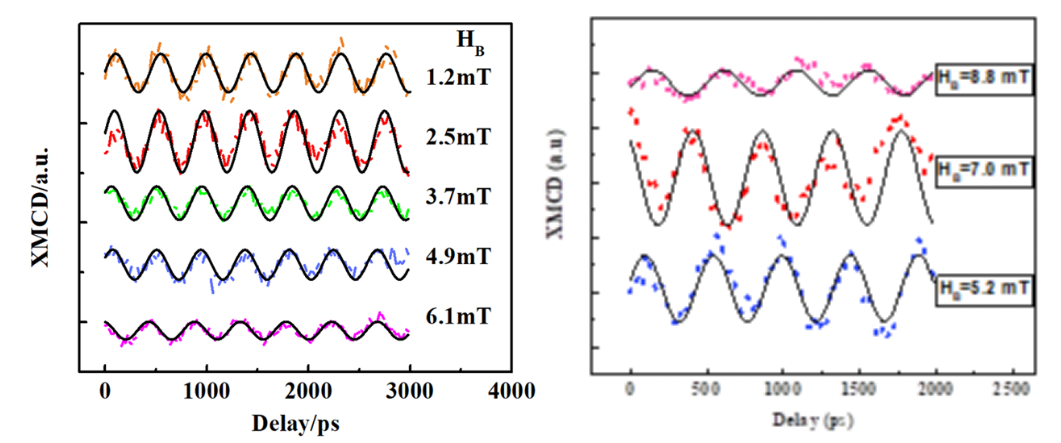
(Left) Ni magnetic moment precession is excited by microwave magnetic field at 2 GHz in different bias fields. Experimental data are represented by colored dots, offset for clarity. Each curve of the spin precession is shown by a solid line after Sine-fitting. (Right) Ni magnetic moment precession is excited by microwave magnetic field at 2 GHz in different bias fields.
附件下载: